Please note that your subscription plan determines the specific set of features available to you, which may result in differences between what you see and the images presented in this article. For further details on the features included in your plan, please contact your OfficeSpace Admin.
The Stats Panel in Move Manager provides you with quick and easy to understand data about your office’s current occupancy. Gather information about your current occupants by department, seats by occupancy, and bookable desks by status.
Navigating to the Stats PanelOccupants ChartSeats ChartBookable Desk Status
Navigating to the Stats Panel
The Stats Panel is located in Move Manager. In Move Manager, select the
Stats Panel icon from the Action Panel on the right-hand side. The Stats Panel then opens.
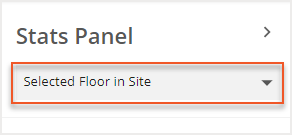
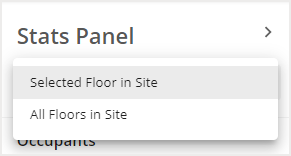
Using the dropdown, you can choose to view the data by the
Selected Floor in Site or by
All Floors in Site.
Occupants Chart
The first chart on the Stats Panel is the Occupants chart. It shows the current number of occupants on the floor plan. Using the dropdown just above the chart, you can view the occupants By Department.
You will see a pie chart that represents the breakdown of occupants by department. To the right of the chart is a key that identifies the color used for each department.
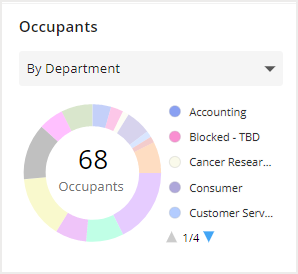
Hover over each color on the chart to see the department distribution on the floor.
Seats Chart
Below the Occupants chart is the Seats chart. This chart shows you the number of occupied and vacant seats on the floor. Using the dropdown just above the chart, you can change the information to be displayed by Department or by Occupancy Status.
By Occupancy Status
If you view the chart by Occupancy Status, you will see the number of occupied seats and vacant seats. You will also see the total occupancy percentage for the floor.
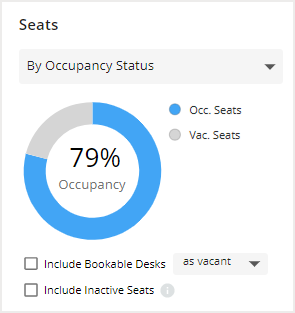
You can select one or both checkboxes below the chart to include Bookable Desks and Inactive Seats in the chart. You have the option of adding Bookable Desks as vacant or occupied seats, using the dropdown next to this checkbox.
Hover over each color on the chart to see the total number of seats for each status.
By Department
When viewing the chart by Department, the total number of seats is displayed in the center of the chart. Each color in the chart shows the number of seats designated to each department on the floor. To the right of the chart is a key that identifies the color used for each department.
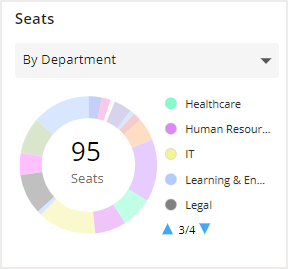
Hover over each color to see the number of seats, how many are occupied, how many are vacant, and the department distribution for the floor.
Bookable Desk Status
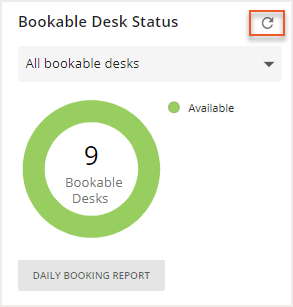
The last chart on the Stats Panel is the Bookable Desk Status chart, which tells you the number of booked desks and available desks on the floor.
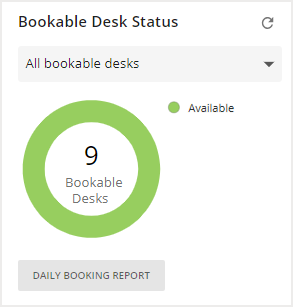
In the center of the chart, you see the total number of bookable desks for the floor. The colors on the chart indicate the number of desks in each desk booking status. To the right of the chart is a key that identifies the color used for each department.
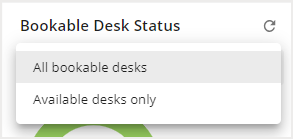
Using the dropdown above the chart, you can adjust the data to see either
All bookable desks or
Available desks only in the chart.
If you want to refresh the Bookable Desk Status chart to show the most current data, select the
refresh icon above the chart.