Please note that your subscription plan determines the specific set of features available to you, which may result in differences between what you see and the images presented in this article. For further details on the features included in your plan, please contact your OfficeSpace Admin.
Requests are an important tool to address the concerns of your employees quickly and efficiently. Positive request resolutions support your team and improve your employees’ experiences within your workspaces. Your management team can use request reporting to keep track of your response time and the effectiveness of your request solutions.
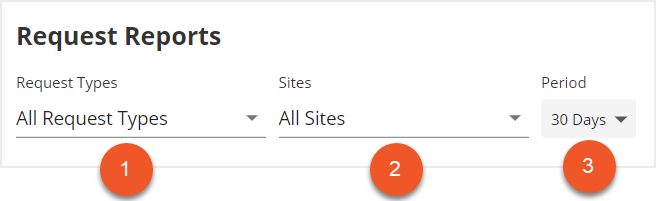
There are two sections in the Reports tab of Request Manager: Request Statistics, and Request Manager Performance. You can use the
Request Types dropdown (1),
Sites dropdown (2), and
Period dropdown (3) to configure the information displayed in the reports.
You must be a System Administrator, Facility Administrator, or Facility Manager to access Request Reports.
Request Statistics Request Manager Performance
Request Statistics
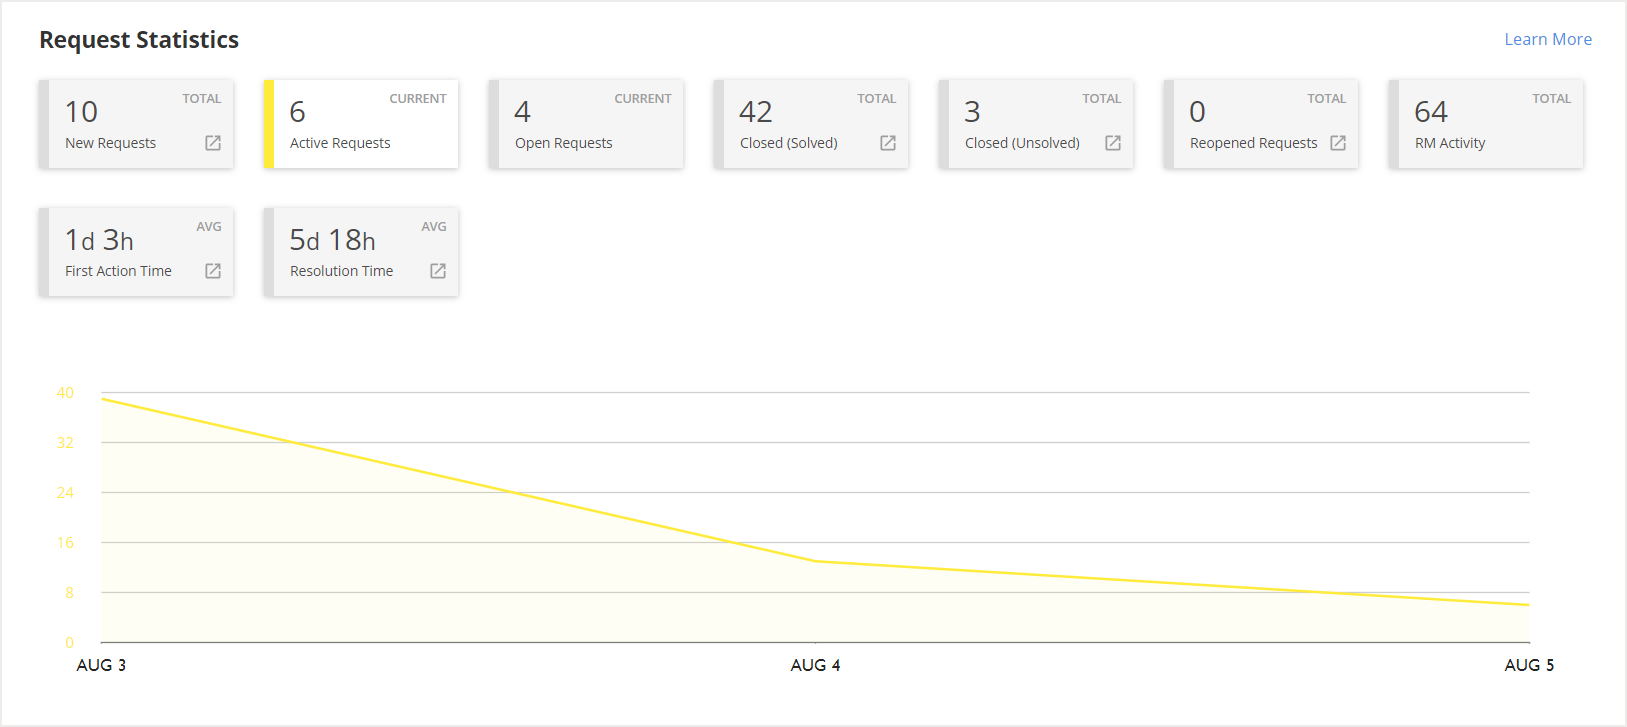
The Request Statistics section provides you with an overview of your request data. Here, you will find a snapshot of the requests that have been submitted, where requests are submitted, how quickly and effectively your requests are resolved, feedback information, and more.
Request Statistics ReportsRequests by SourceRequests by TypeSurvey ResultsRequests by LocationSLA Breach ReportsSLA Performance Counts
Request Statistics Reports
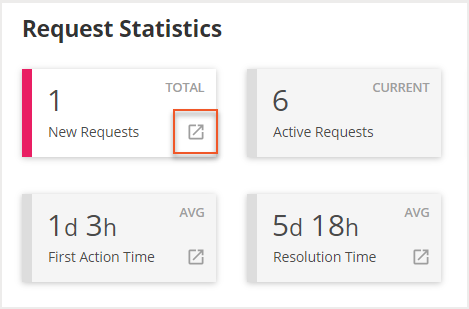
The Request Statistics reports display the trends in specific request data over a given period of time. By choosing one of the category selectors, you can view a line graph that provides specific information about that category.
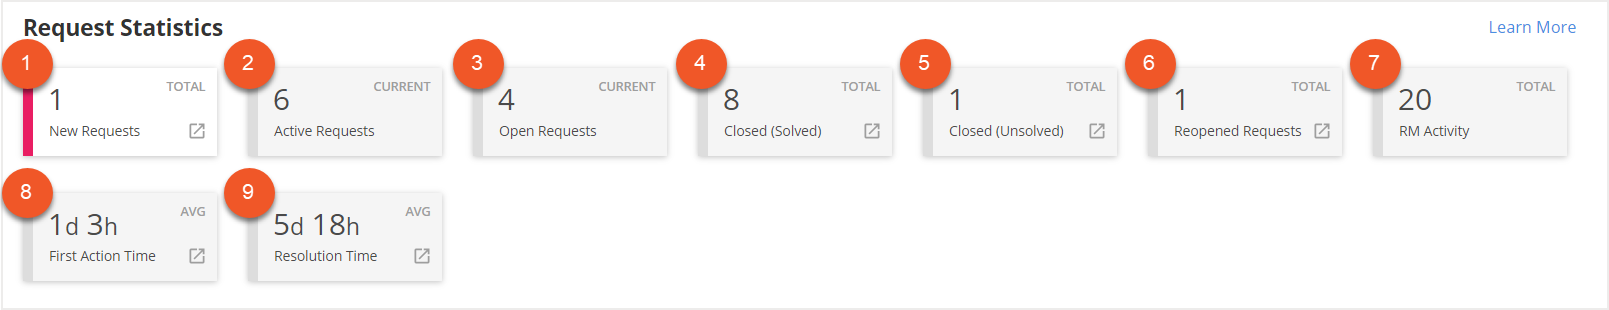
The selectors include
New Requests (1),
Active Requests (2),
Open Requests (3),
Closed (Solved) (4),
Closed (Unsolved) (5),
Reopened Requests (6),
RM Activity (7),
First Action Time (8), and
Resolution Time (9).
If you want to see or download more detailed information, select the
expand icon on one of the selectors.
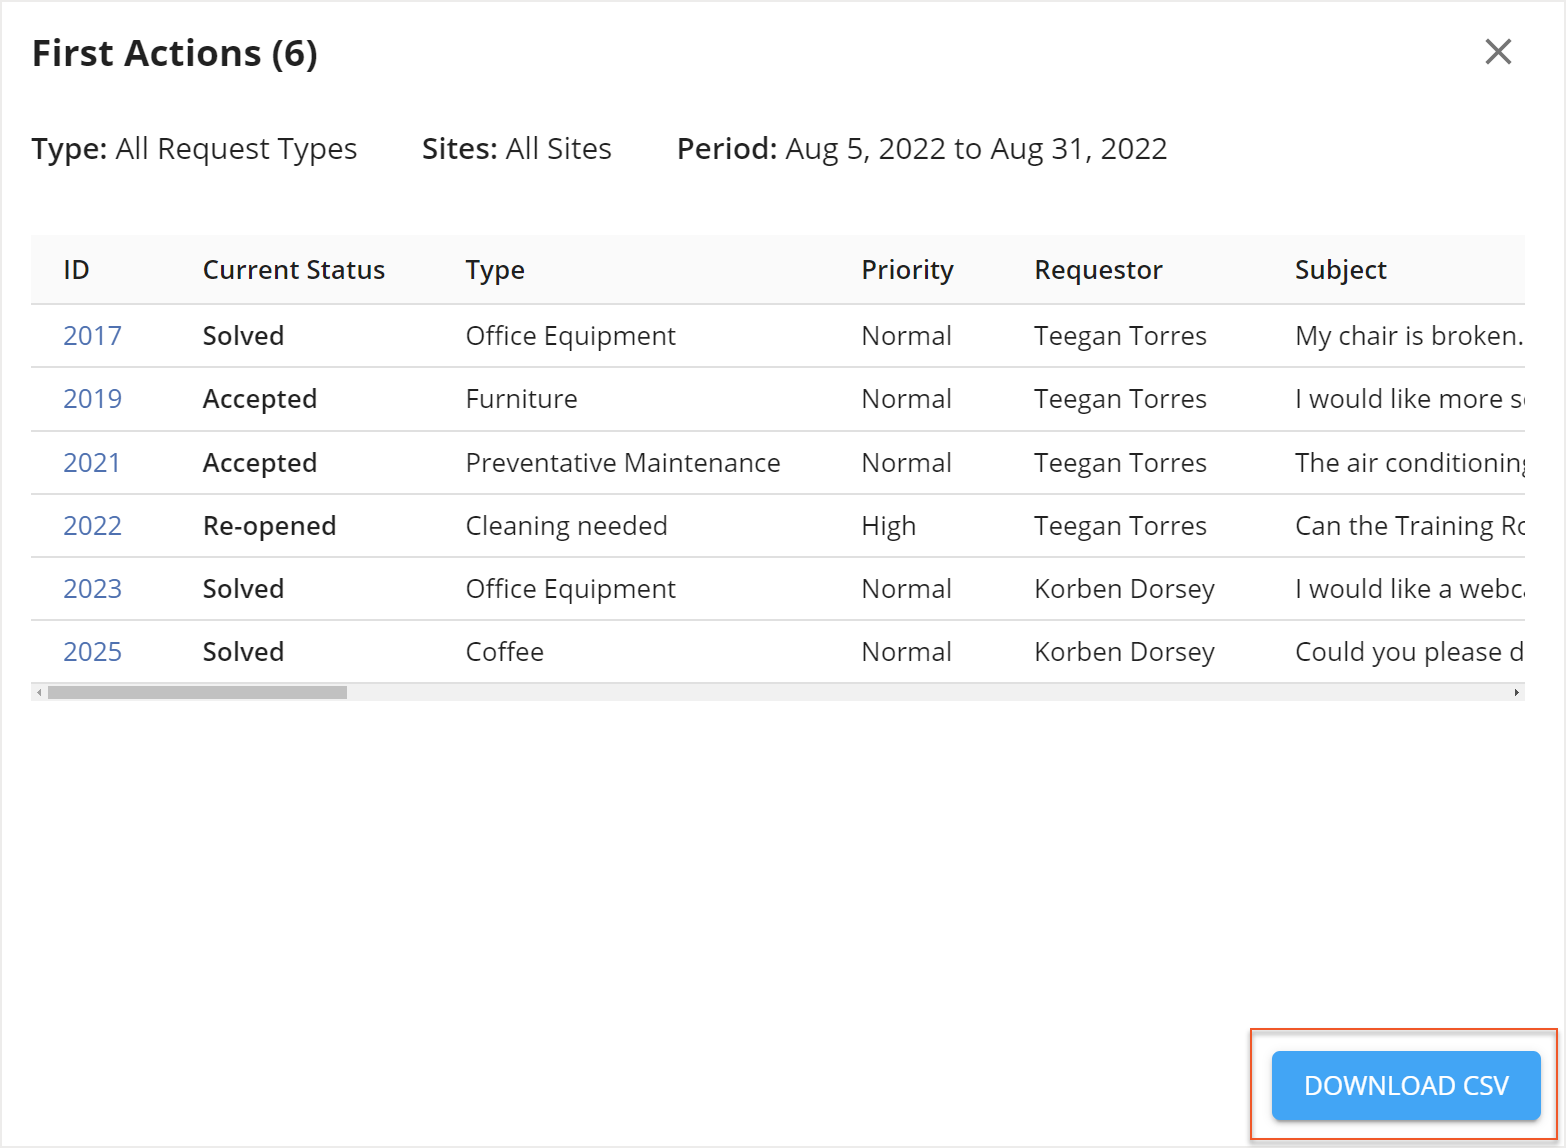
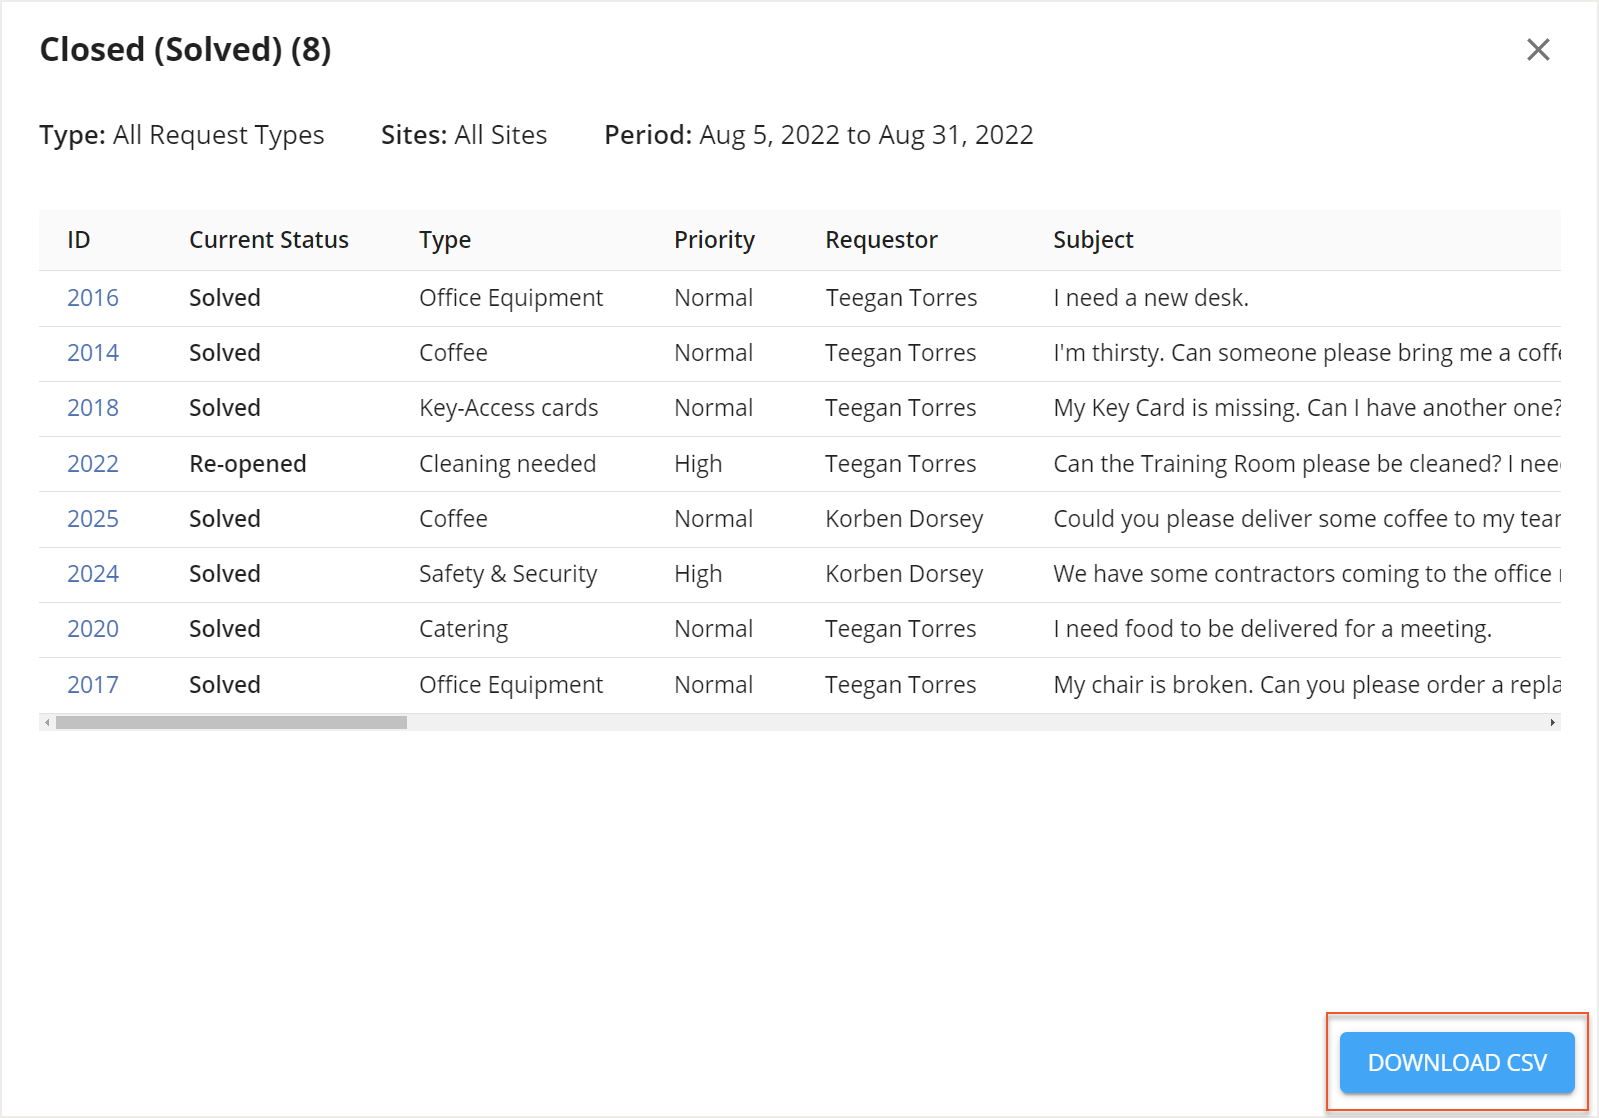
A more detailed report will open, showing all the requests that are included in the data displayed. Select
Download CSV to download a CSV file of the detailed report.
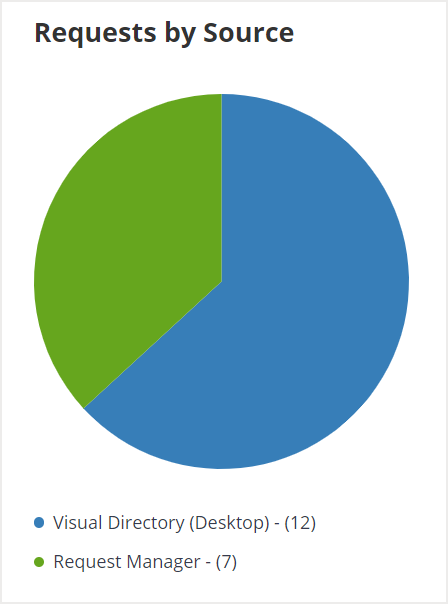
Requests by Source
The Requests by Source pie chart provides you with insight about which platforms your employees are using to submit requests. Users are able to submit requests from a variety of sources, including through Visual DirectoryⓇ, Request Manager, the mobile app, or even by email. Use the legend at the bottom of the chart to view which color corresponds to which source.
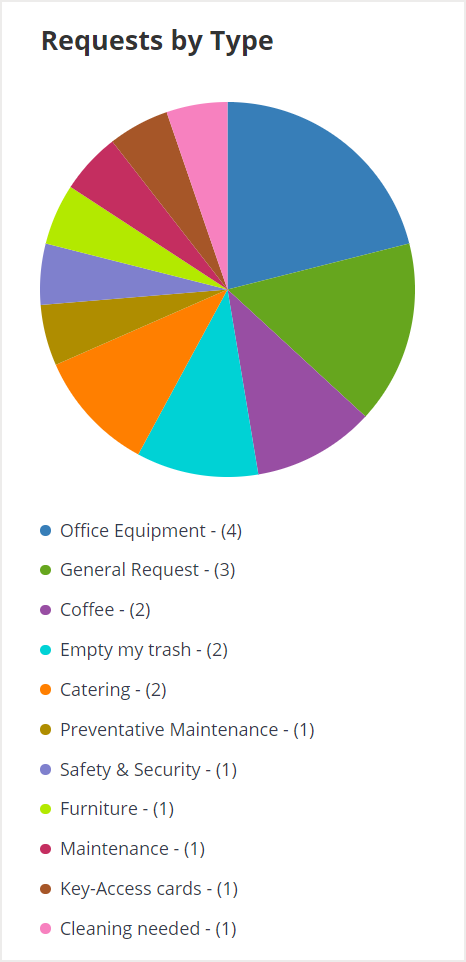
Requests by Type
You can use the Requests by Type pie chart to view what types of requests are being submitted more frequently. Use the legend at the bottom of the chart to view which color corresponds to which request type. You can also hover over each section of the pie chart to see what percentage that request type contributes to the total amount of submitted requests.
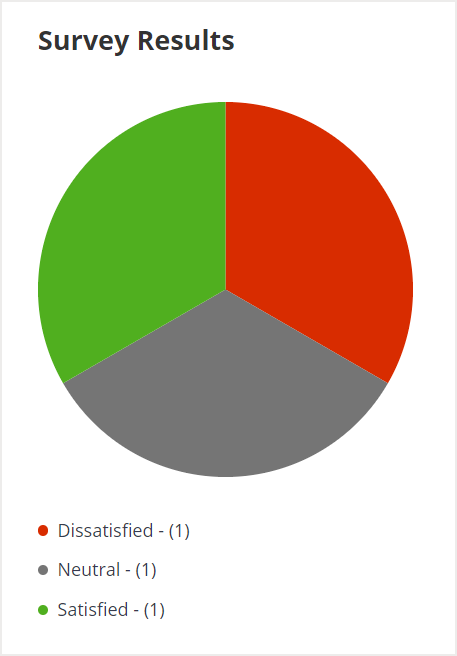
Survey Results
If your company has enabled feedback for request types, you can view the results of the feedback with this chart. Using the legend, you can view how many requests have received a Satisfied, Neutral, or Dissatisfied response after resolution.
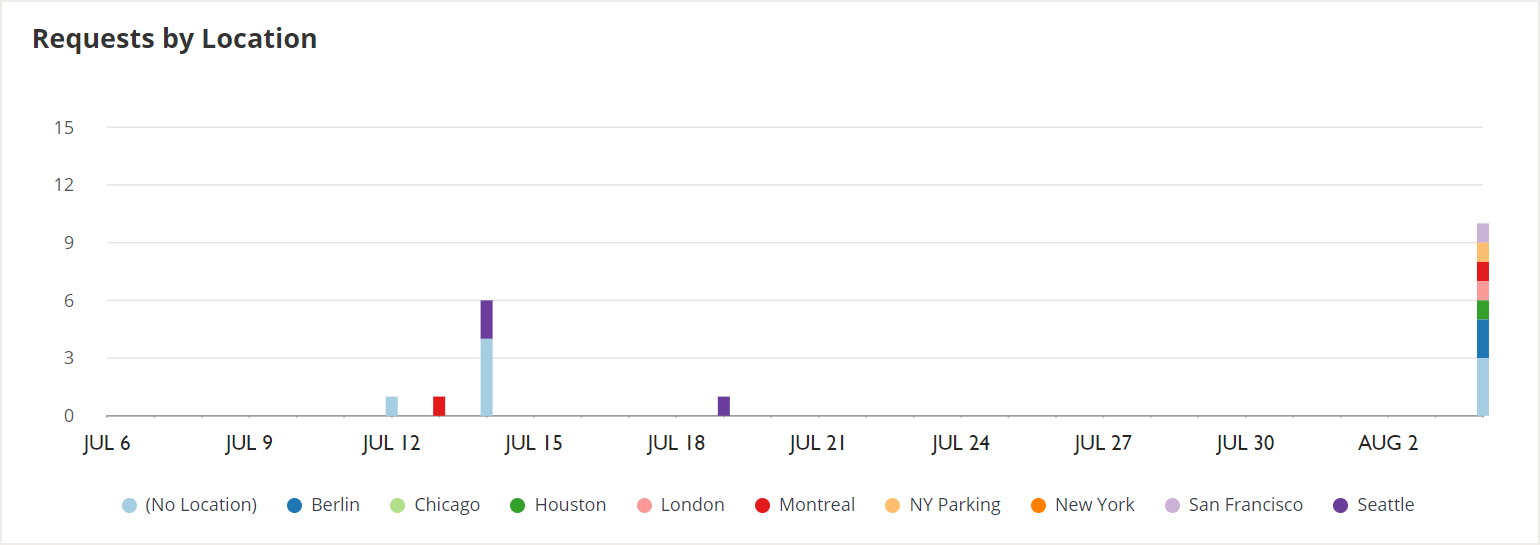
Requests by Location
The Requests by Location graph displays an overview of the locations from which requests have been submitted during a specified time period. Use the legend below the graph to identify which location(s) have had request submissions.
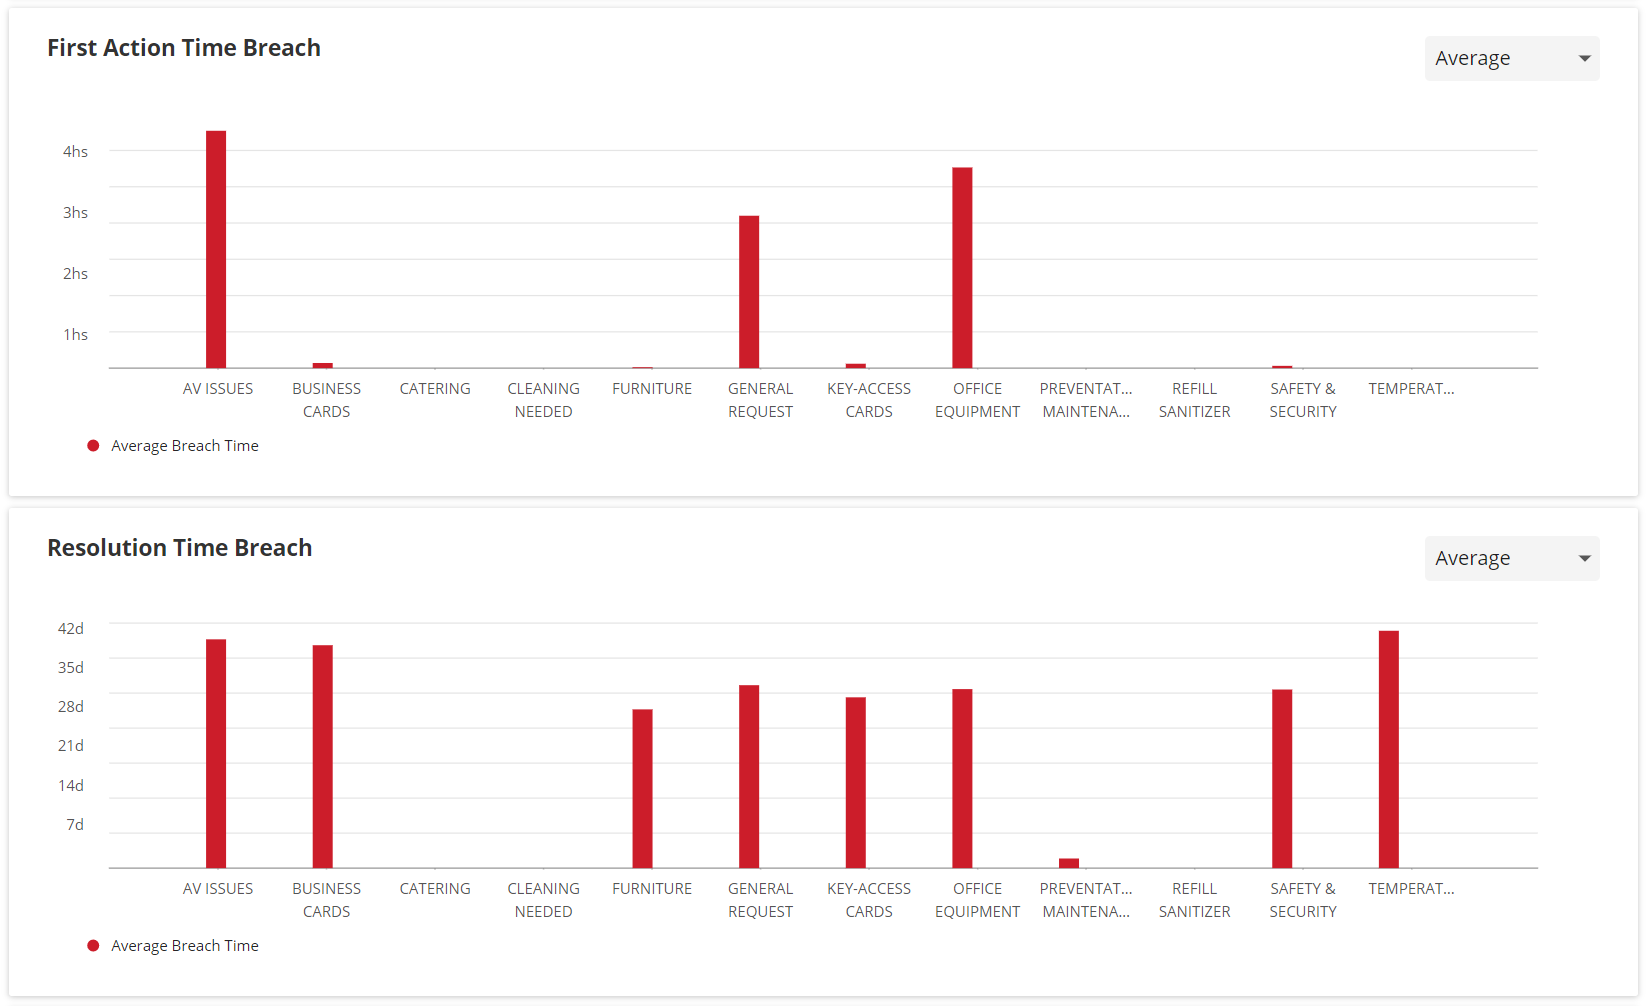
SLA Breach Reports
You can use the First Action Time Breach report and the Resolution Time Breach report to quickly view the SLA target breaches by request type. These reports show you the average and median First Action or Resolution breach times for each type of request.
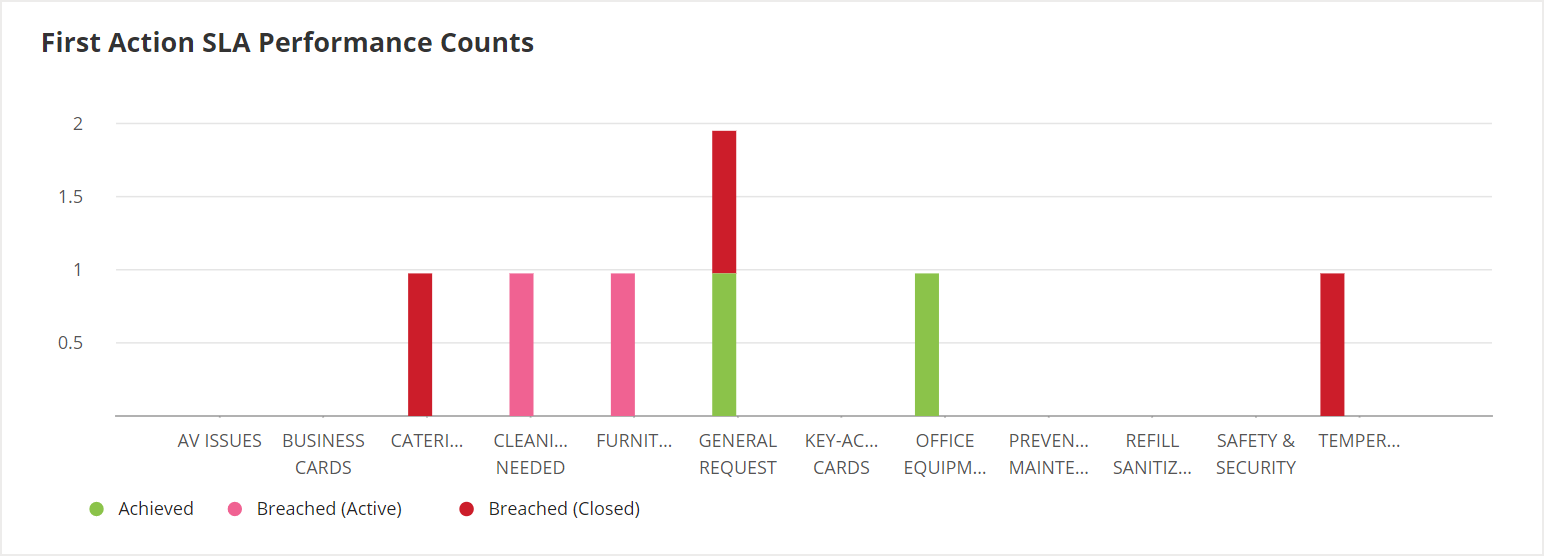
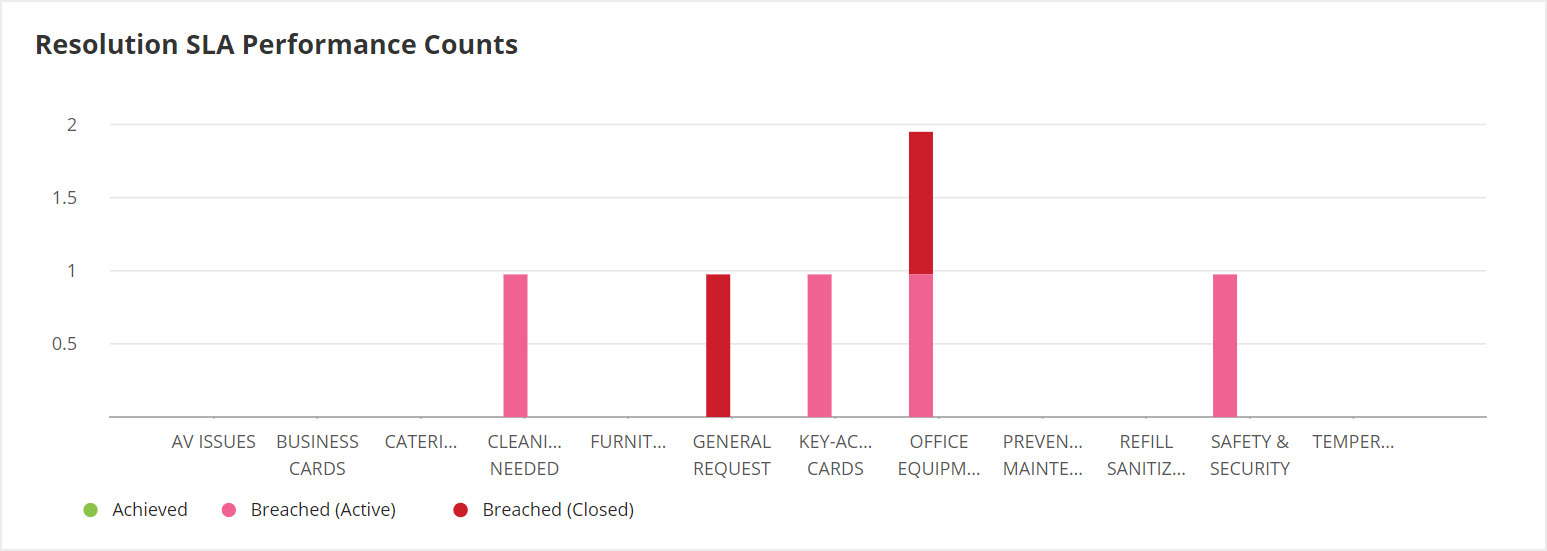
SLA Performance Counts
The First Action SLA Performance Counts report and the Resolution SLA Performance Counts report display an overall look at your SLA data. Using these reports, you can view how many times your First Action and Resolution targets have been achieved and how many have been breached, both for active and closed requests, based on request type.
Request Manager Performance
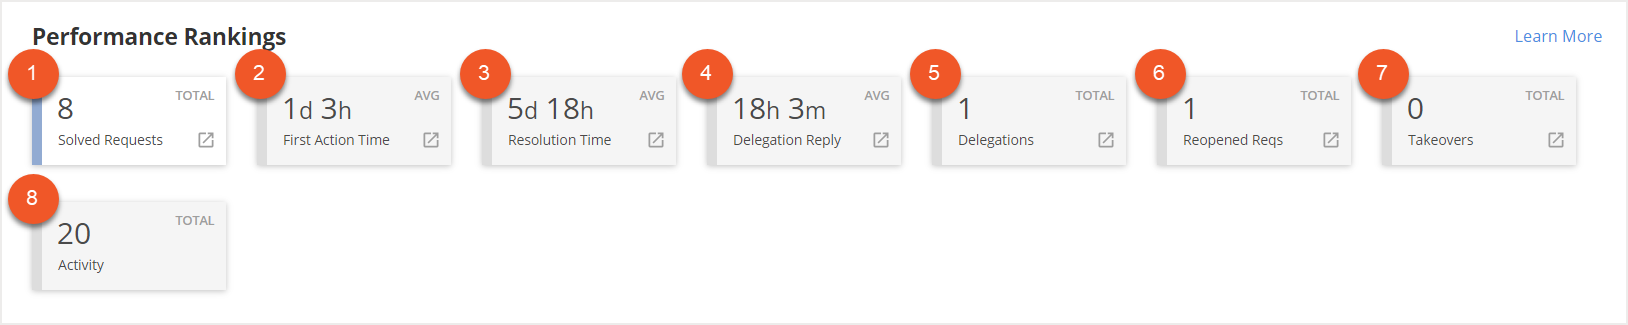
The Request Manager Performance tab can be used to view requests data by Request Manager, giving you an overview of how effective each manager is at resolving their requests. Use the selectors under Performance Rankings to display a variety of information, as listed below.
These selectors include
Solved Requests (1),
First Action Time (2),
Resolution Time (3),
Delegation Reply (4),
Delegations (5),
Reopened Requests (6),
Takeovers (7), and
Activity (8).
If you want to see or download more detailed information, select the
expand icon on one of the selectors.
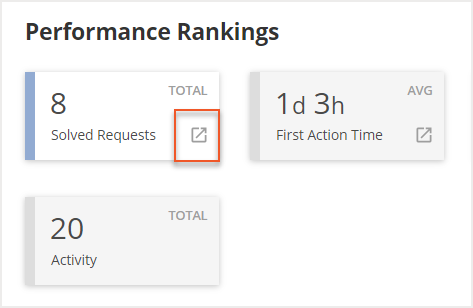
A more detailed report then opens, showing all the requests that are included in the data displayed. Select
Download CSV to download a CSV file of the detailed report.
 Solved RequestsFirst Action TimeResolution Time
Delegation Reply
Delegations
Reopened Requests
Takeovers
Activity
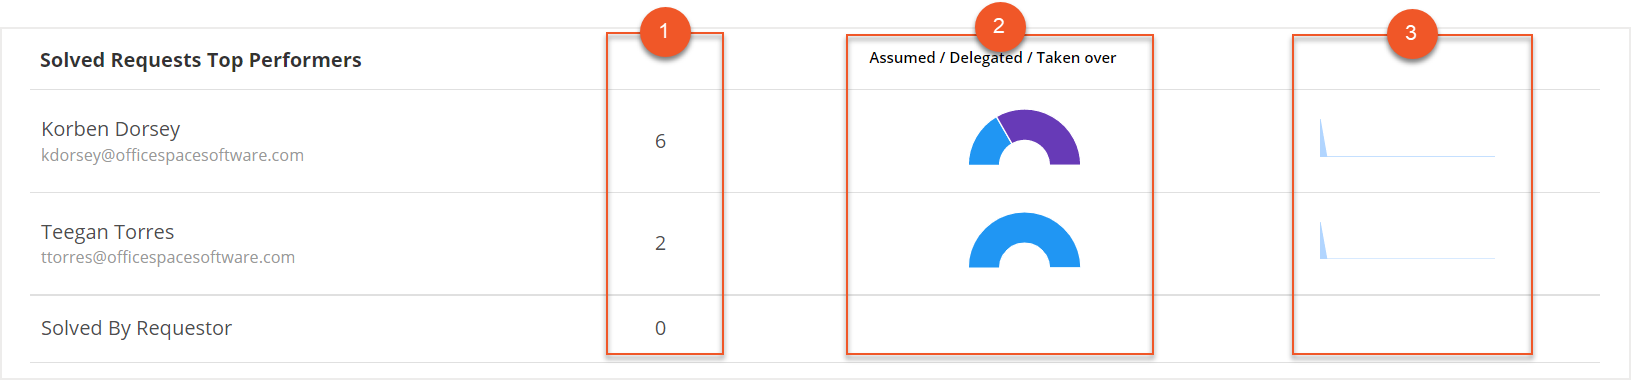
Solved Requests
Selecting the Solved Requests Top Performers will display a list of the Request Managers who have solved the most requests within the selected time period. You can view the
total number of solved requests (1), a
chart of the requests that have been Assumed/Delegated/Taken over (2), and a
simple graph (3) showing the trends in solving requests.
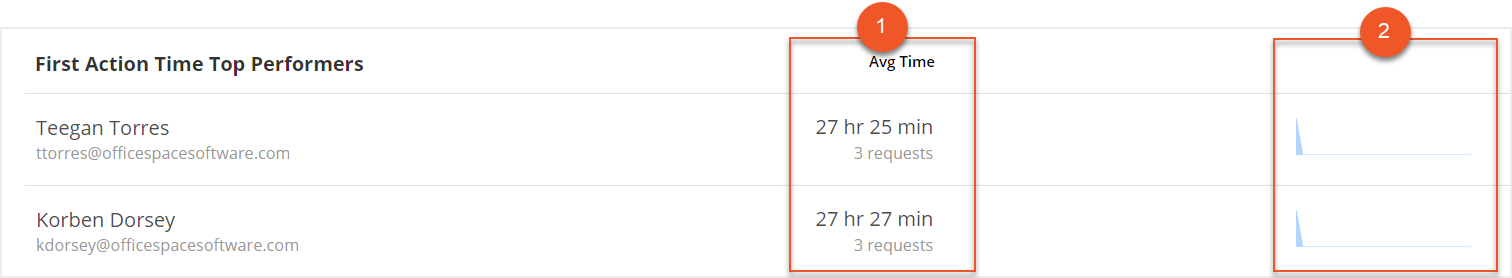
First Action Time
First Action Time Top Performers will show the Request Managers with the best First Action times. This selector shows their
average time (1) for a first action and a
simple graph (2) to display the trends in taking the first action.
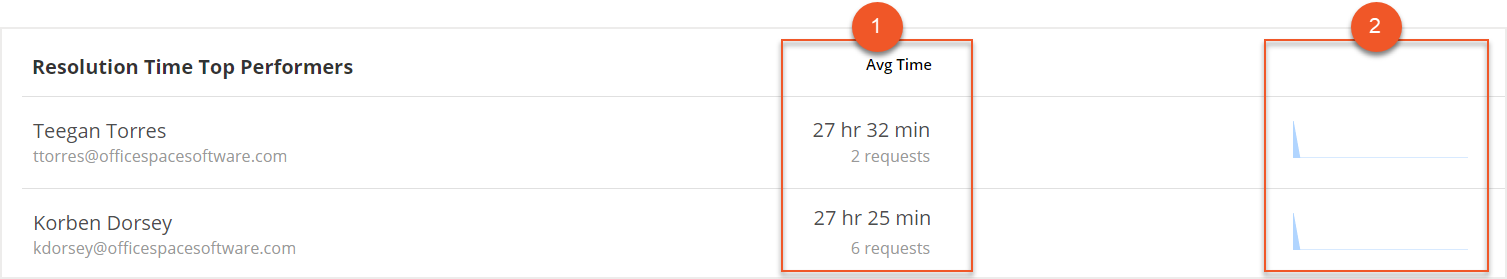
Resolution Time
Resolution Time Top Performers will show the Request Managers with the best Resolution times. This selector shows their
average time (1) for a resolution and a
simple graph (2) to display the trends in resolving requests.
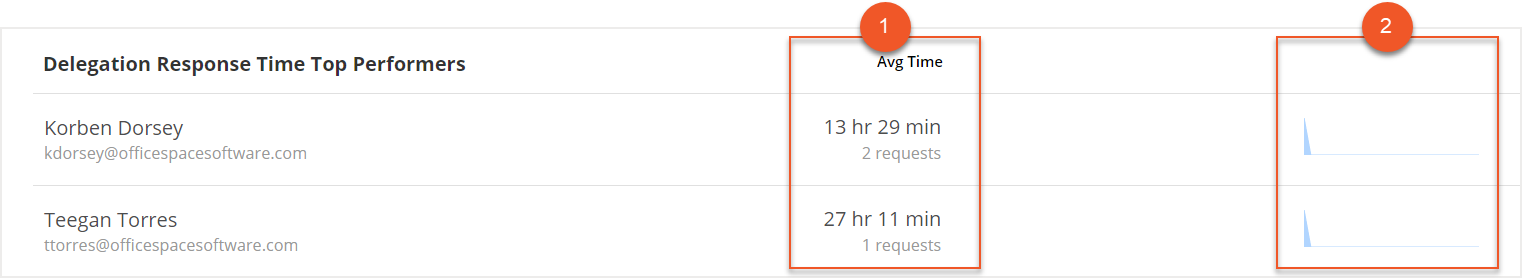
Delegation Reply
The Delegation Response Time Top Performers displays the time it takes to respond to a delegated request, either by accepting the request or rejecting it. This selector shows their
average time (1) for a delegation response and a
simple graph (2) to display the trends in responses.
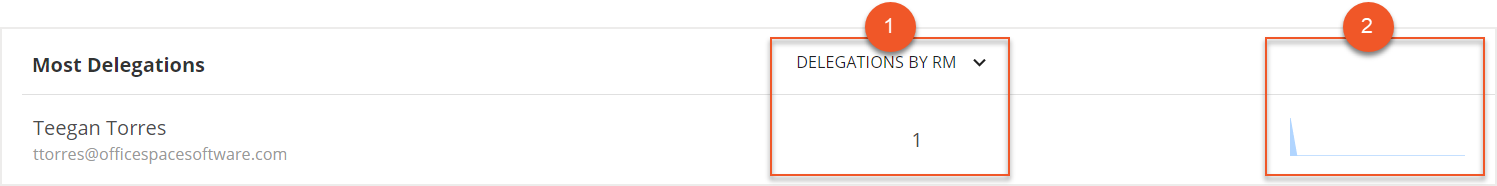
Delegations
The Delegations selector displays information about the Request Managers with the most delegations. You can use the
dropdown (1) to view the data for Delegation by a Request Manager or Delegations to a Request Manager, as well as a
simple graph (2) to view the trends in delegations.
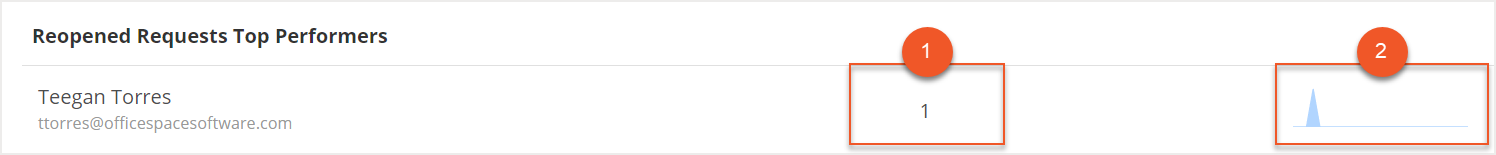
Reopened Requests
Reopened Requests Top Performers shows you the Request Managers who have managed a reopened request. The selector includes the
number of reopened requests (1) by Request Manager and a
simple graph (2) to display the trends in reopened requests.
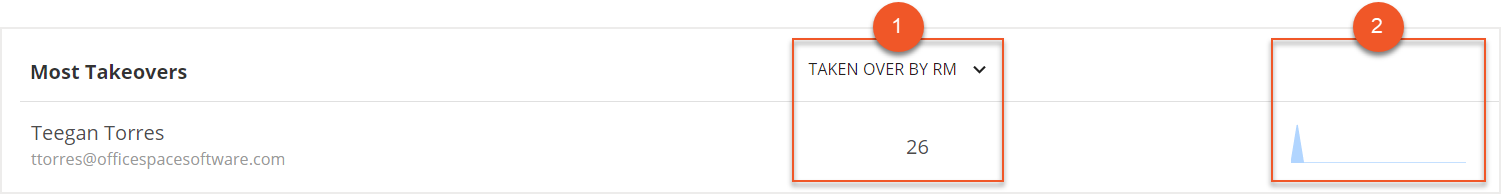
Takeovers
The Takeovers selector displays information about the Request Managers with the most takeovers. You can use the
dropdown (1) to view data for requests Taken Over by a Request Manager or requests Taken Over from a Request Manager, as well as a
simple graph (2) to view the trends in takeovers.
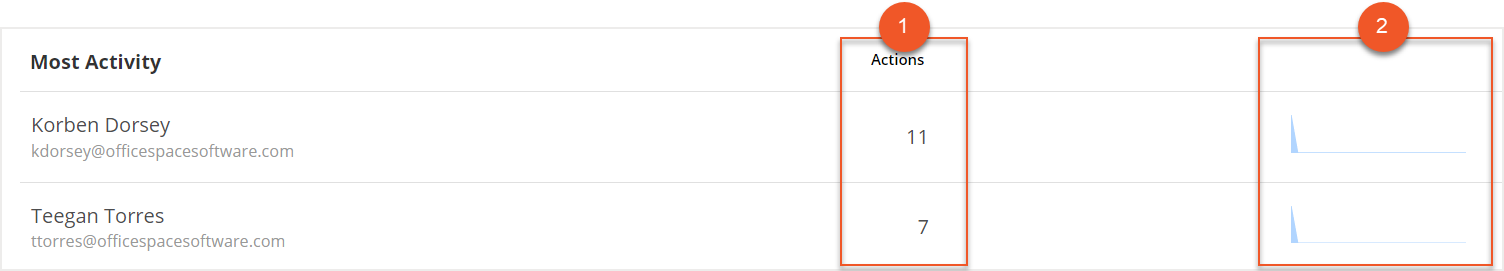
Activity
The Activity selector displays data about the Request Managers who have taken the most actions on requests over the selected time period. You can view the
number of actions taken (1) by the Request Manager and a
simple graph (2) that shows the trends in their activity.