Please note that your subscription plan determines the specific set of features available to you, which may result in differences between what you see and the images presented in this article. For further details on the features included in your plan, please contact your OfficeSpace Admin.
The reports in Insights Hub contain many different tools that allow you to customize your reports' appearances and filter the information displayed, so that the reports generated serve your particular needs.
SortingDropdownsRefresh, Expand/Collapse/Switch View, DownloadFiltersEditing and Bulk EditingGraphs and Charts Reports Glossary
Sorting
Each report offers various sorting capabilities. By selecting the
arrow next to most report columns, it's possible to sort the information in them in either ascending or descending order.
You can also select multiple columns to sort (in priority order) by shift-selecting the column name to give it a priority. To go back to single-sort, alt-select the column you would like to be primary.
To change the order of the columns on a report, select and hold on the column you wish to move, then drag the column to its new location.
It's also possible to hide columns in many of the reports. If the report settings dropdown is available, select it, and then select the Show/Hide columns option to choose which columns should be visible. Then, select Apply to confirm the changes.
Some reports may have unique features not mentioned in this guide. For information on the unique features of each report, see the guide for the
specific reporting area.
Dropdowns
Each report contains different
dropdowns underneath the report title, allowing a variety of organizational functions and different views. Some reports, like the
People Reports, allow you to filter out records that are active or inactive. Others may allow you to use custom views that your System Administrator can create, to show you very specific subsets of data.

Refresh, Expand/Collapse/Switch View, Download
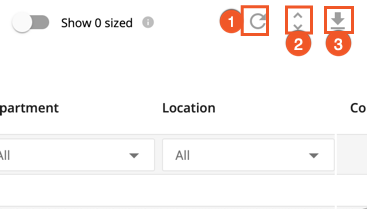
You can
refresh (1) your data with the most recent information available,
expand and collapse (2) all of the rows in the data, and
download (3) a copy of the data in Excel format using the buttons in the top-right corner of the report.
If you'd like to expand or collapse a single row of data, use the
expand and collapse arrow next to the individual row.
If there are more layers to the data, another expand collapse button will be selectable. Some reports may not include the expand and collapse button.

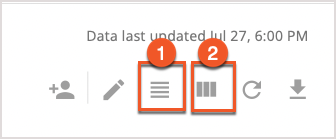
Some reports have a
switch view icon (1) or a
manage columns icon (2) in place of the expand and collapse button. The switch view icon compresses the rows so that more data is visible at once, and the manage columns icon allows you to select what columns to show on the report.
Filters
Most reports contain a row of filters across the top of the data, below any dropdown menus. These filters allow you to customize your view of the data by attributes. For example, some reports allow you to filter by a specific site or city, and others allow you to filter by neighborhood or department.

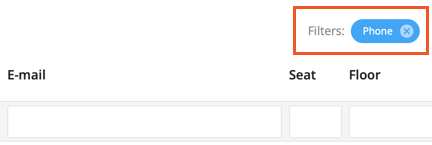
You can keep track of what filters are in place on the right side of the report, under the refresh, expand/collapse, and download icons. Filters will be displayed with blue markers, as below.
It's possible that the filters in a report are customizable. Speak to your System Administrator or OfficeSpace representative to inquire about filter customization, if you feel it would help navigate a particular report.
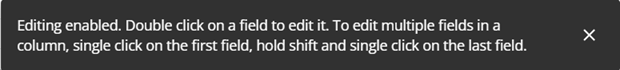
Editing and Bulk Editing
Many of the reports allow you to edit their fields using the
Edit icon in the top-right corner. It is also possible to perform
Bulk Editing on some reports, by selecting multiple fields and inputting the data you would like to overwrite, using your keyboard's Shift key + click.
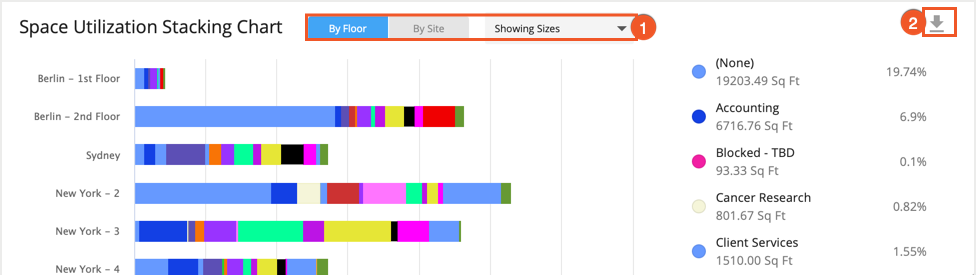
Graphs and Charts
Many of the reports present you with a visual overview of the data, in the form of a chart or a stacked graph. The views can be customized using
view selectors and pickers along the top (1), providing you with the required data in an easy-to-read format. Like the full data, charts can be downloaded using the
download icon (2) in their top-right corner.
Graphs and charts must be downloaded using this button, as they are not downloaded along with the report itself.
If you're looking to hide the visuals for a particular report, the toggle can be found to the right of the dropdown menus at the top of the report.
Reports Glossary
The table below lists commonly-used terms found in report guides and also used for reports in the Insights Hub.
| Term | Definition |
|---|
| Active Employee | This is a person currently employed by your organization. |
| Auto-Declined | Used in the context of check-ins, this means that the system has declined a booking. |
| Bookable Desk | This is a desk that is bookable by a user who has permissions to do so. |
| Booking | This is the act of reserving a desk or room using OfficeSpace and is also used as a data point for reporting purposes. |
| Canceled | Used in the context of bookings, this means that a booking was canceled, by the occupant, system, or an administrator. |
| Capacity | The maximum number of available desks. |
| Check-In | This is the act of confirming a booking and is also used as a data point for reporting purposes. |
| Completed | Used in the context of bookings, this means that a booking has reached its scheduled end time. |
| Deactivated Employee | This is a person who was working for your organization, but whose record is no longer active in OfficeSpace. |
| Declined | Used in the context of check-ins, this means that a Booking Manager has declined someone's request for a desk. |
| Desk | This is a seating area for an individual. It may contain assets that can also be tracked across reports, such as dual monitor displays. |
| Dropdowns | These are the menus above the filters on a report. |
| Ended | Used in the context of bookings, this means that a user has checked into a booking, but then ended the booking prior to the end of the booking time. |
| Failed Check-In | Used in the context of check-ins, this means that a user failed to check in within the check-in window your organization has set. |
| Filter | These are the sorting tools found above the report data, allowing you to exclude and include data in your view of the report, based on the criteria they are set for. |
| Floor Plan | Within OfficeSpace, this is the visual representation of a floor. Displays desks, rooms, and utilities/resources. |
| Floor | This is the area in a location where people in your organization work, gather, and of course, book desks. |
| Location | This refers to a place that is geographically based (a site, a floor, or even a room or a desk), in general. |
| Occupancy | Generally given as a percentage in Insights Hub, this metric refers to a portion of desks that are occupied, relative to a specific capacity. |
| Room | A shared area that is surrounded by walls, often used for a specific purpose, for example, a conference room. Can be bookable or non-bookable. |
| Seat | See Desk. |
| Site | This is the branch, office, or building that houses floors. |
| Space | Refers to the amount of area in a location, displayed in square feet or square meters. |
| Utilization Period | This is the time period over which a particular space, room, or desk was utilized. |
| Utilization | Generally, this refers to how a particular space, room, or desk was utilized. But it can also refer to how often that desk was utilized. |
| Vacant Desk | This is a desk that is not currently occupied. |